Mg/Ca Worked Example
In practice, you will calculate the free energies for each phase from some method (e.g. calphy)
and then use landau for the plotting. This data was obtained from Atomic Cluster Expansion models run by calphy.
Load Free Energies into Landau
Here, we read the free energies as a function of temperature from a dataframe.
Prelude
import pandas as pd
import landau as ld
Load Free Energies
df = pd.read_pickle("MgCaFreeEnergies.pckl.gz")
def build(row):
    return ld.phases.TemperatureDependentLinePhase(row.phase, row.composition, row.temperature, row.free_energy, interpolator=ld.interpolate.SGTE(4))
df['phaseobj'] = df.apply(build, axis=1)
df
| phase | composition | temperature | free_energy | state | phaseobj | |
|---|---|---|---|---|---|---|
| 0 | hcp Mg | 0.000000 | [300.0, 300.0042000588008, 300.0084002352066, ... | [-1.5225154593605692, -1.5225168694102966, -1.... | solid | TemperatureDependentLinePhase("hcp Mg") |
| 1 | bcc Ca | 1.000000 | [300.0, 300.00461545700705, 300.0092310560326,... | [-1.9342844504225414, -1.9342865724018383, -1.... | solid | TemperatureDependentLinePhase("bcc Ca") |
| 2 | Mg$_2$Ca | 0.333333 | [300.0, 300.0042000588008, 300.0084002352066, ... | [-1.781469669607899, -1.7814711895104098, -1.7... | solid | TemperatureDependentLinePhase("Mg$_2$Ca") |
| 4 | fcc Ca | 1.000000 | [300.0, 300.0042000588008, 300.0084002352066, ... | [-1.9365957848456883, -1.9365976398227, -1.936... | solid | TemperatureDependentLinePhase("fcc Ca") |
| 14 | liquid | 0.333273 | [800.0, 800.0053333635558, 800.0106667982238, ... | [-2.020797043491122, -2.020801126471374, -2.02... | liquid | TemperatureDependentLinePhase("liquid") |
| 15 | liquid | 0.666636 | [800.0, 800.0053333635558, 800.0106667982238, ... | [-2.161913993730873, -2.1619183103650097, -2.1... | liquid | TemperatureDependentLinePhase("liquid") |
| 18 | liquid | 0.000000 | [600.0, 600.0060000600006, 600.0120002400048, ... | [-1.632069098400621, -1.6320727216435675, -1.6... | liquid | TemperatureDependentLinePhase("liquid") |
| 19 | liquid | 1.000000 | [1000.0, 1000.0057143126531, 1000.011428690613... | [-2.3851575945277173, -2.3851625203296583, -2.... | liquid | TemperatureDependentLinePhase("liquid") |
| 22 | liquid | 0.166636 | [800.0, 800.0053333635558, 800.0106667982238, ... | [-1.9109840875275999, -1.9109880541330522, -1.... | liquid | TemperatureDependentLinePhase("liquid") |
| 23 | liquid | 0.500000 | [800.0, 800.0053333635558, 800.0106667982238, ... | [-2.1026342137400933, -2.102638434385509, -2.1... | liquid | TemperatureDependentLinePhase("liquid") |
| 24 | liquid | 0.833273 | [800.0, 800.0053333635558, 800.0106667982238, ... | [-2.2026799550501632, -2.2026842763304164, -2.... | liquid | TemperatureDependentLinePhase("liquid") |
def combine(dd):
    if len(dd) == 1:
        return dd.phaseobj.iloc[0]
    else:
        return ld.phases.InterpolatingPhase(dd.phase.iloc[0], dd.phaseobj.tolist(), num_coeffs=3)
phases = df.groupby('phase')[df.columns].apply(combine).tolist()
Check Interpolation
import matplotlib.pyplot as plt
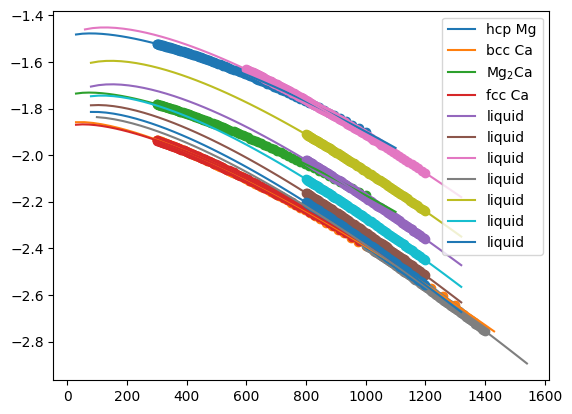
for p in df.phaseobj:
    p.check_interpolation(Tl=.1)
plt.legend()
<matplotlib.legend.Legend at 0x7f33b23897f0>
Save to Pickle
import pickle
with open("MgCaPhases.pckl", 'wb') as f:
    pickle.dump(phases, f)
Plotting Diagrams
With the phase objects created landau can calculate and plot the phase diagram for us.
Prelude
import pandas as pd
import landau as ld
import numpy as np
import seaborn as sns
Load
Read existing phase objects from file.
phases = pd.read_pickle("MgCaPhases.pckl")
Calculate Diagram
%%time
df = ld.calculate.calc_phase_diagram(
    phases,
    Ts=np.linspace(100, 1500, 50),
    mu=150,
    keep_unstable=True
)
CPU times: user 6.69 s, sys: 17.2 ms, total: 6.71 s
Wall time: 6.78 s
df
| T | phase | phi | mu | c | stable | border | refined | f | f_excess | |
|---|---|---|---|---|---|---|---|---|---|---|
| 0 | 100.000000 | Mg$_2$Ca | -1.480066 | -0.757406 | 0.333333 | True | True | no | -1.732535 | -0.123050 |
| 1 | 100.000000 | Mg$_2$Ca | -1.482567 | -0.749905 | 0.333333 | True | True | no | -1.732535 | -0.123050 |
| 2 | 100.000000 | Mg$_2$Ca | -1.485065 | -0.742411 | 0.333333 | True | True | no | -1.732535 | -0.123050 |
| 3 | 100.000000 | Mg$_2$Ca | -1.487513 | -0.735066 | 0.333333 | True | True | no | -1.732535 | -0.123050 |
| 4 | 100.000000 | Mg$_2$Ca | -1.489922 | -0.727839 | 0.333333 | True | True | no | -1.732535 | -0.123050 |
| ... | ... | ... | ... | ... | ... | ... | ... | ... | ... | ... |
| 38576 | 549.789157 | Mg$_2$Ca | -1.805706 | -0.265398 | 0.333333 | True | True | delaunay-triple | -1.894172 | 0.058977 |
| 38577 | 549.789157 | bcc Ca | -1.805706 | -0.265398 | 1.000000 | True | True | delaunay-triple | -2.071104 | 0.000000 |
| 38578 | 736.553962 | liquid | -1.730833 | -0.808065 | 0.083914 | True | True | delaunay-triple | -1.798641 | -0.045205 |
| 38579 | 736.553962 | hcp Mg | -1.730833 | -0.808065 | 0.000000 | True | True | delaunay-triple | -1.730833 | 0.000000 |
| 38580 | 736.553962 | Mg$_2$Ca | -1.730833 | -0.808065 | 0.333333 | True | True | delaunay-triple | -2.000188 | -0.179570 |
38581 rows × 10 columns
Plot
Raw
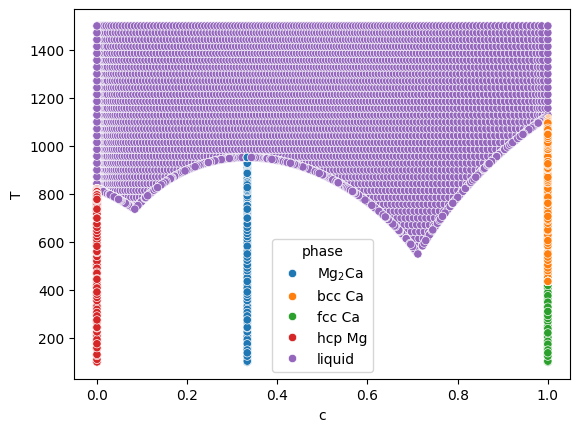
sns.scatterplot(
    data=df.query('stable'),
    x='c', y='T',
    hue='phase',
)
<Axes: xlabel='c', ylabel='T'>
Colorful
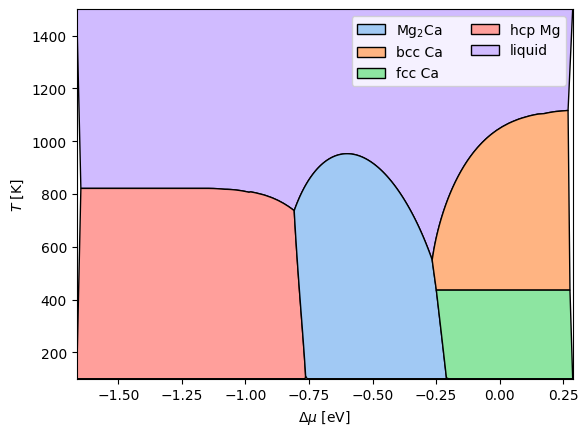
ld.plot.plot_mu_phase_diagram(df)
/home/pmrv/.mamba/envs/landau/lib/python3.13/site-packages/landau/poly.py:37: FutureWarning: DataFrameGroupBy.apply operated on the grouping columns. This behavior is deprecated, and in a future version of pandas the grouping columns will be excluded from the operation. Either pass `include_groups=False` to exclude the groupings or explicitly select the grouping columns after groupby to silence this warning.
  return self.prepare(df).groupby(['phase', 'phase_unit']).apply(
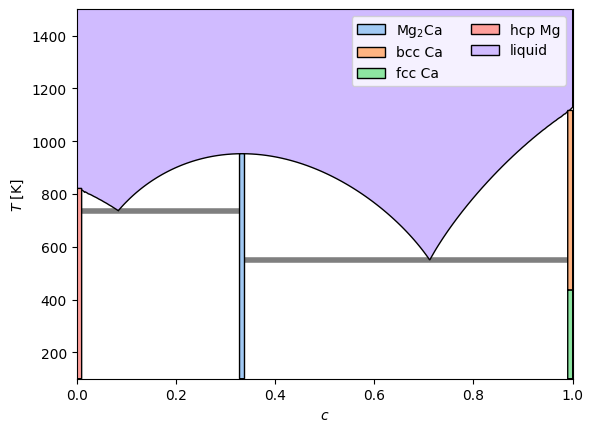
ld.plot.plot_phase_diagram(df, tielines=True)
/home/pmrv/.mamba/envs/landau/lib/python3.13/site-packages/landau/poly.py:37: FutureWarning: DataFrameGroupBy.apply operated on the grouping columns. This behavior is deprecated, and in a future version of pandas the grouping columns will be excluded from the operation. Either pass `include_groups=False` to exclude the groupings or explicitly select the grouping columns after groupby to silence this warning.
  return self.prepare(df).groupby(['phase', 'phase_unit']).apply(
/home/pmrv/.mamba/envs/landau/lib/python3.13/site-packages/landau/plot.py:96: FutureWarning: DataFrameGroupBy.apply operated on the grouping columns. This behavior is deprecated, and in a future version of pandas the grouping columns will be excluded from the operation. Either pass `include_groups=False` to exclude the groupings or explicitly select the grouping columns after groupby to silence this warning.
  tdf.groupby("border_segment").apply(plot_tie)